Active Sector Rotation Strategy

Active Rotation
Active rotation is a dynamic investment strategy that requires regular portfolio adjustments to capitalize on evolving market conditions. Compared to other investment strategies, active rotation might be more time-consuming and complex, but it also presents greater potential for higher returns. By continually tweaking portfolio holdings, investors can exploit market inefficiencies and mispricings, potentially yielding higher returns than a traditional buy-and-hold strategy.
Active rotation also serves as a risk management tool. Regular portfolio adjustments allow investors to sidestep overvalued assets likely to face a price decline, thus safeguarding the portfolio from significant losses. Moreover, active rotation is highly adaptable to market shifts. In the face of rapidly changing markets, it enables investors to promptly adapt to novel market conditions and seize emerging opportunities.
In this article, we delve into the merits of active rotation, particularly focusing on sector rotation.
Sector rotation
There are several different strategies that investors can employ when implementing an active rotation strategy. One such prevalent approach is sector rotation, which involves shifting investments between different sectors within the market.
- Rotation of sectors based on behavior depending on the phase of the business cycle. Understanding the business cycles can help identify sectors that are likely to outperform or underperform during a specific period.
- Changes in U.S. Federal Reserve's monetary policies serve as a leading indicator for sector rotation within portfolios. Empirical studies suggest that an easy monetary policy favors stocks from cyclical sectors, whereas a tight monetary policy tends to yield better results for non-cyclical sector stocks.
- Inflation, reflected in the Consumer Price Index (CPI), significantly impacts sector performance. Typically, energy, materials, and real estate sectors perform well during inflationary periods as these sectors can pass on increased costs to consumers. Conversely, consumer staples and utilities sectors often underperform due to struggles in transferring increased costs to consumers.
- Сhanges in employment can be a factor for sector rotation. Strong employment growth can boost consumer discretionary sectors like retail and travel due to increased disposable income. High unemployment can favor consumer staples sectors, as consumers focus on essentials. Employment shifts can also affect healthcare and financial sectors, influencing healthcare coverage accessibility and borrowing/lending activities.
- Momentum investing involves buying assets that have shown strong recent performance and selling assets that have shown weak recent performance. This approach can be applied to sectors as well, with investors rotating into sectors that have shown strong performance and out of sectors that have shown weak performance.
- Unique sector characteristics can enhance predictive power. These could include specific financial ratios or key data points that are characteristic of each sector's performance.
Most methods of classifying the business cycle identify four stages. For instance, Fidelity's classification includes: Early-cycle phase, Mid-cycle phase, Late-cycle phase, and Recession phase.
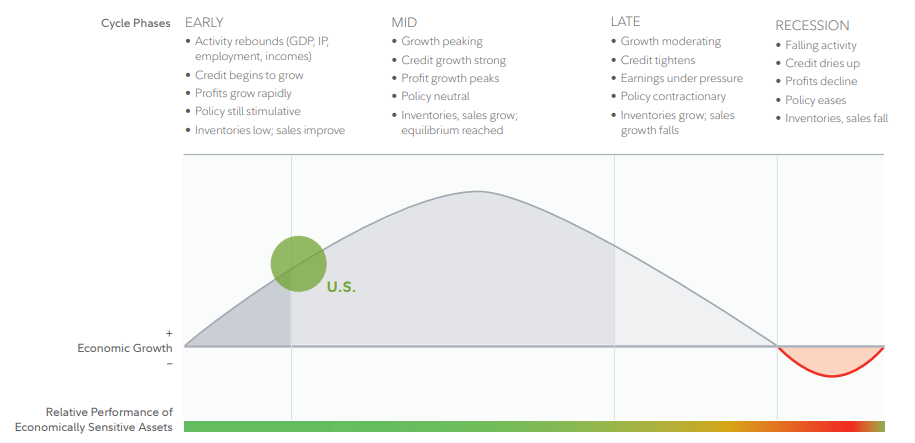
- Early-cycle phase. Generally, a sharp recovery from a recession, marked by an inflection from negative to positive growth in economic activity (for e.g. gross domestic product, industrial production), then an accelerating growth rate. Credit conditions stop tightening amid easy monetary policy, creating a healthy environment for rapid margin expansion and profit growth. Business inventories are low, while sales growth improves significantly.
- Mid-cycle phase. Typically the longest phase of the business cycle. The mid-cycle is characterized by a positive but more moderate rate of growth than that experienced during the early-cycle phase. Economic activity gains momentum, credit growth becomes strong, and profitability remains healthy during an accommodative, though increasingly neutral, monetary policy backdrop. Inventories and sales grow, reaching equilibrium relative to each other.
- Late-cycle phase. This stage typically represents an "overheated" economy that is on the brink of recession, burdened by rates of inflation that exceed the trend. Economic growth rates decelerate to "stall speed" due to a backdrop of restrictive monetary policy, dwindling credit availability, and falling corporate profit margins. As sales growth slows, inventories tend to build up unexpectedly.
- Recession phase. Characterized by a contraction in economic activity. Corporate profits decrease and credit becomes scarce for all economic actors. Monetary policy tends to be more accommodating, and despite low sales levels, inventories gradually decrease, paving the way for the next recovery.
Leading sectors vary according to the market conditions of each stage of the business cycle.
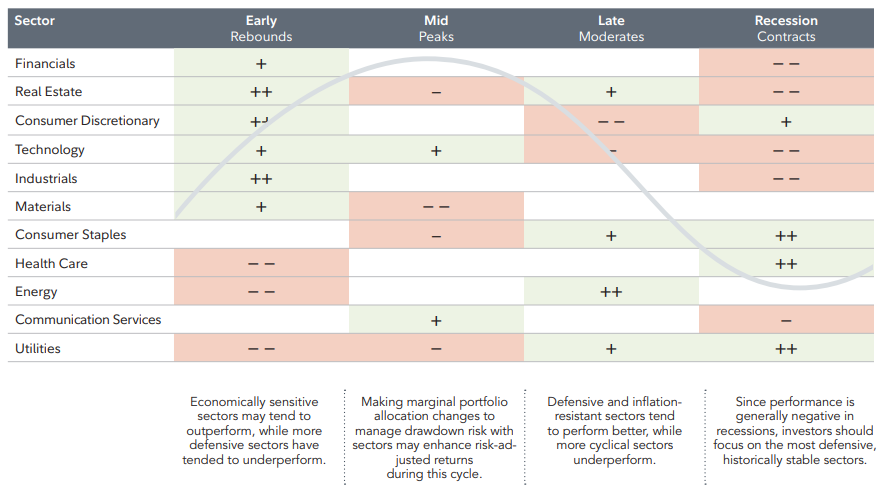
- In the Early-cycle phase, sectors like consumer goods, financial services, and real estate typically lead the broader market's advance, benefiting from low interest rates and the initial signs of economic improvement. Meanwhile, sectors like healthcare and utilities, which generally exhibit steady demand throughout the cycle, tend to lag during this phase. The transition from recession to recovery provides a boost to economically sensitive sectors such as industrials and information technology.
- In the Mid-cycle phase, as the economy moves beyond the initial recovery stage and growth rates moderate, the leadership of interest rate-sensitive sectors typically fades. While economically sensitive sectors maintain strong performance, there's often a shift towards industries that experience peak demand only after the economic recovery is well-established. Information technology emerges as the top-performing sector during this phase. Communication services, largely due to the strength of the media industry at this stage, also show strong performance. In contrast, the materials and utilities sectors typically lag behind in performance.
- In the Late-cycle phase, the energy sector usually shows strong performance as the economic recovery matures and inflationary pressures build up. As signs of economic deceleration emerge, defensive-oriented sectors - those whose revenues are primarily tied to essential needs and are less dependent on economic conditions - generally perform well. These sectors include consumer staples and utilities. Conversely, information technology and consumer discretionary stocks often lag, suffering the most during this phase. This is due to inflationary pressures compressing profit margins and investors shifting away from the most economically sensitive sectors.
- In the Recession phase, as economic growth decelerates and contracts, defensive sectors typically outperform others. These less economically sensitive sectors, including consumer staples, utilities, and healthcare, represent industries that provide goods consumers are unlikely to reduce their spending on during a recession. Notably, the consumer staples sector consistently outperforms the broader market throughout the entire recession phase. Sectors that are more sensitive to economic conditions and interest rates, such as finance, industrials, information technology, and real estate, generally exhibit weaker performance.
Sector rotation based on business cycle stage
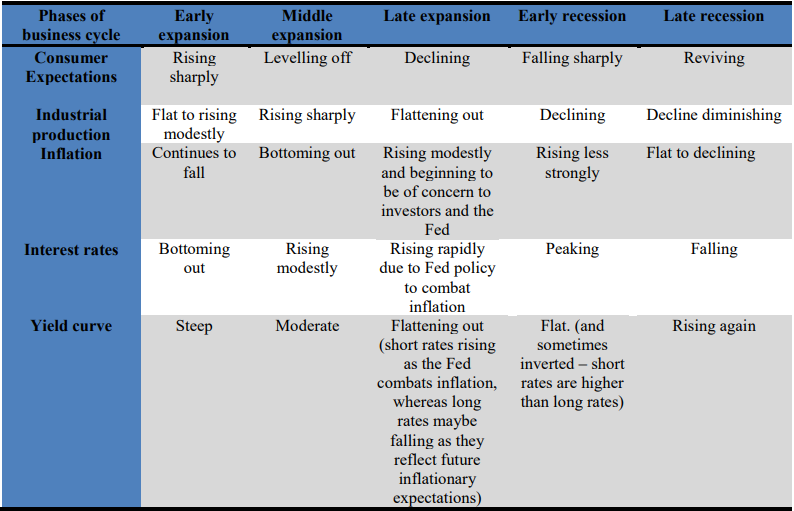
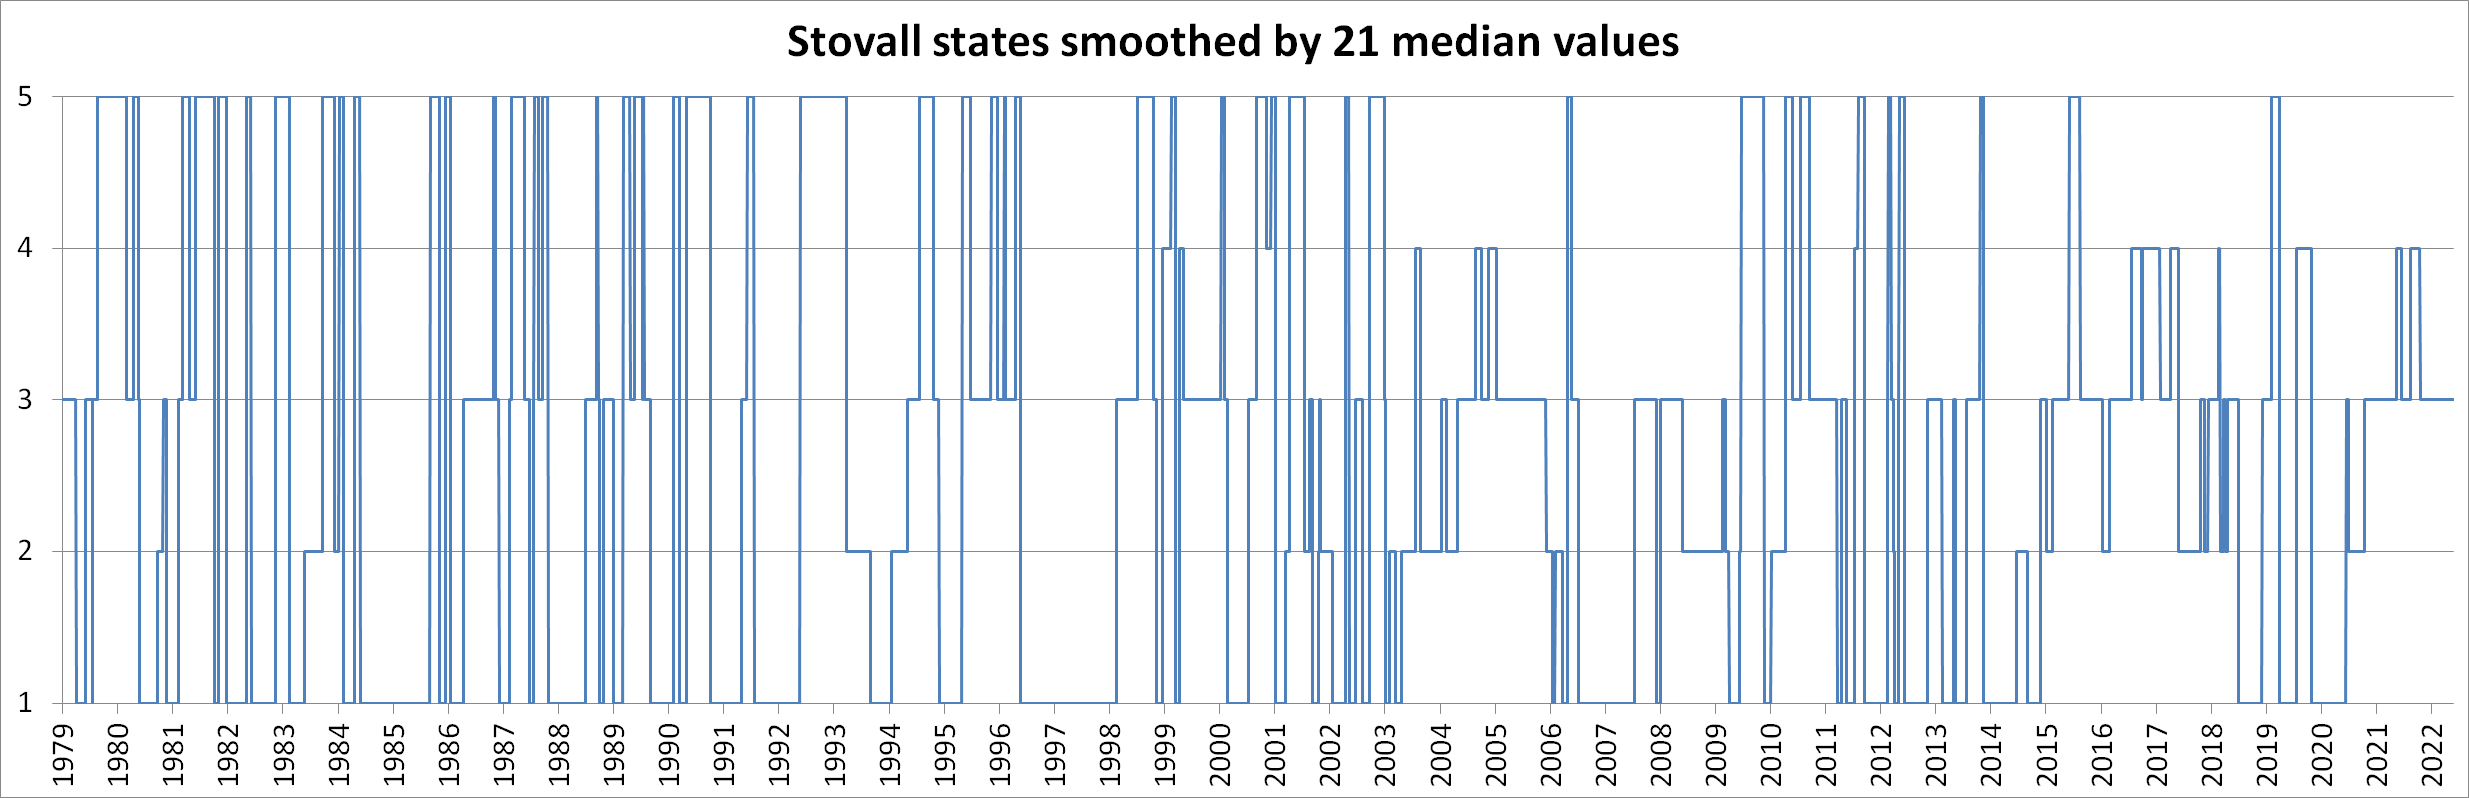
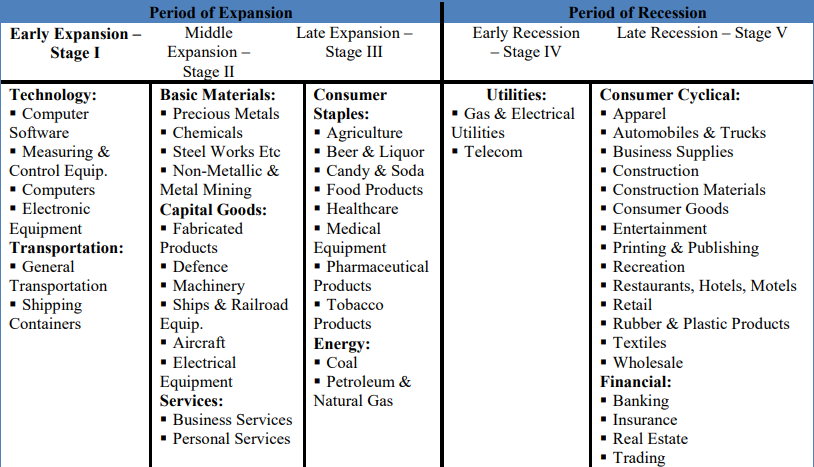
For an illustrative implementation of the sector rotation strategy, let's employ Stovall's (1996) business cycle classification, which identifies five stages of the cycle. Each stage is marked by changes in five economic factors: Consumer Expectations, Industrial Production, Inflation, Interest Rates, and the Yield Curve.
Utilizing vintage data and annual standardized values for each factor, we identify the states in accordance with the table above. Additionally, to smooth out the states and eliminate uncommon back-and-forth transitions, we utilize the median state within a one-month window. The chart below illustrates the dynamics of changing phases of the business cycle, with 1 representing Early Expansion and 5 denoting Late Recession.
The results of Stovall's 1996 study suggest that during specific phases of the business cycle, certain sectors are more favorable for investment and can potentially generate returns above the market average.
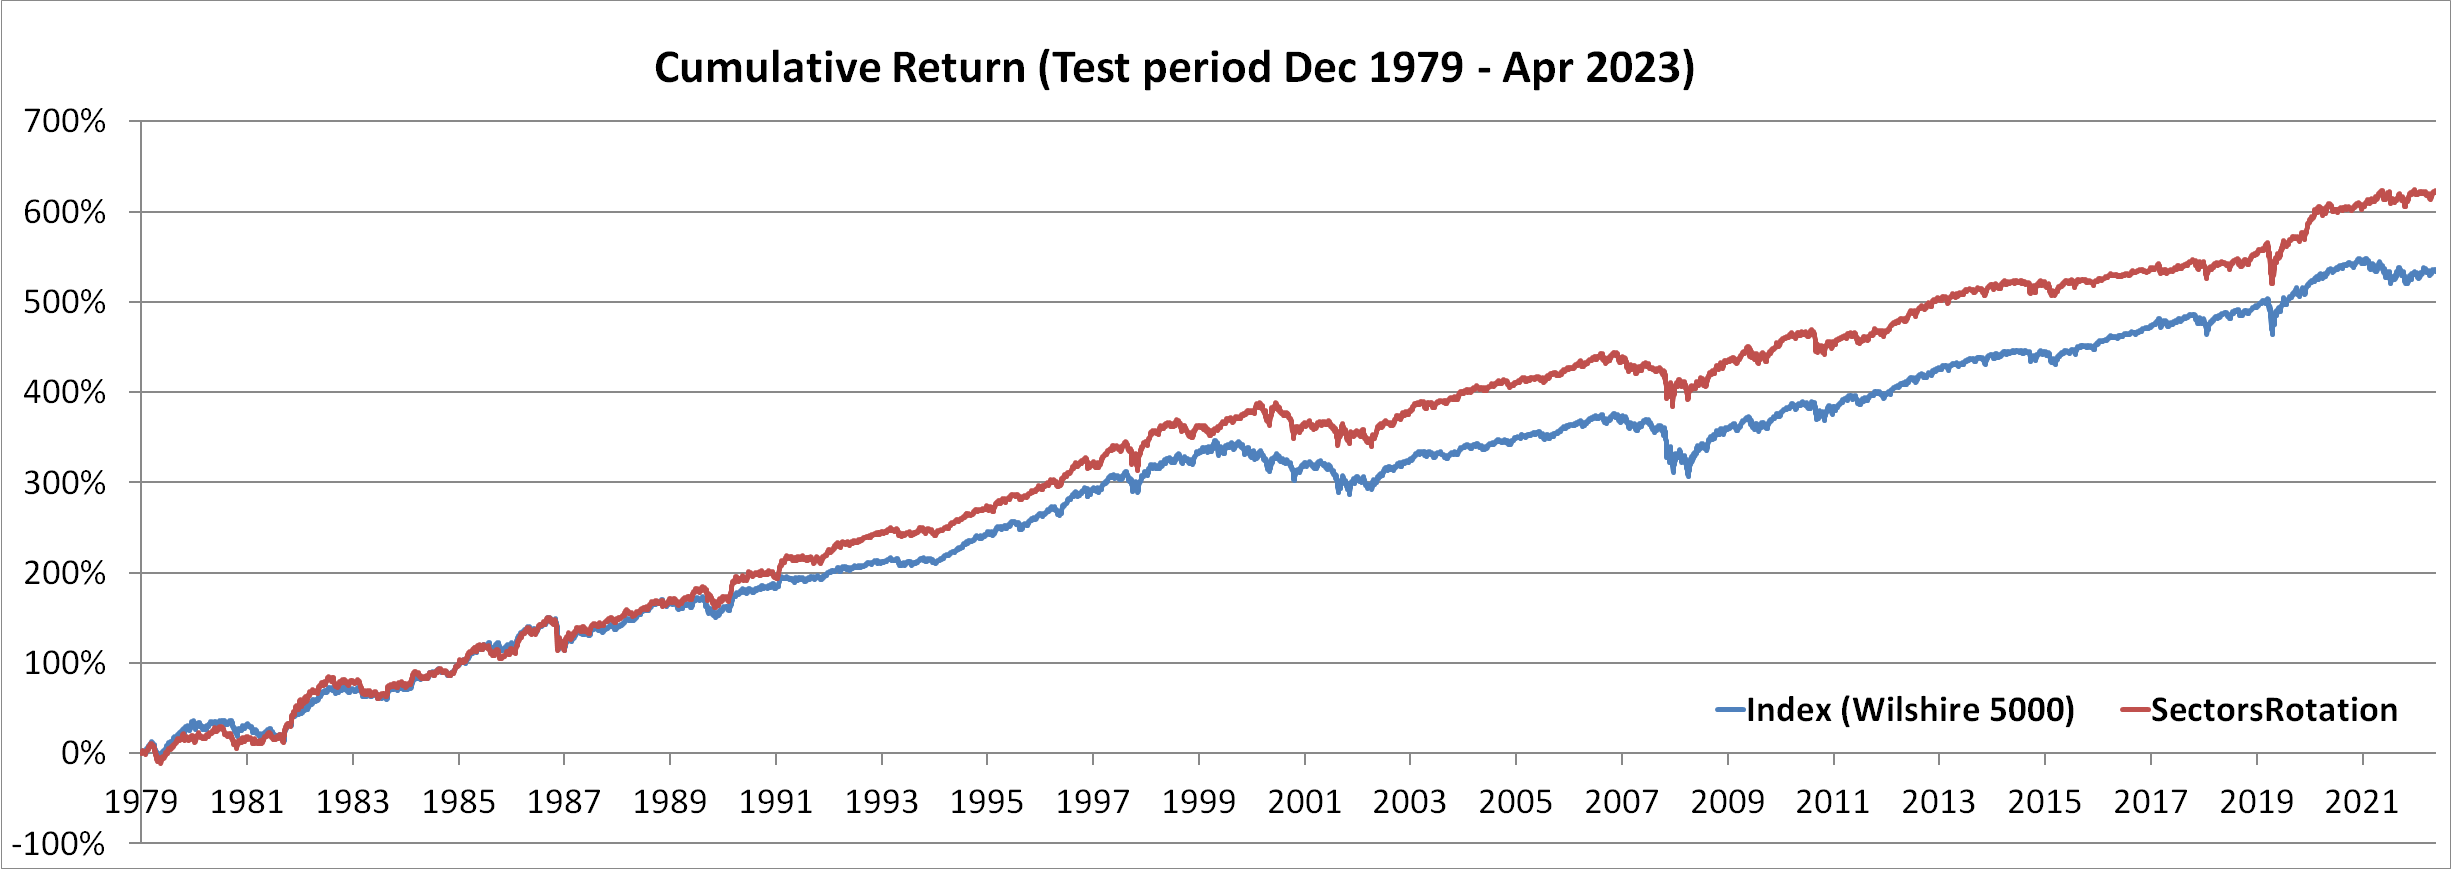
Using the identified stages of the business cycle, we construct portfolios consisting of sectors relevant to each stage. The table below presents the Sharpe and CAGR metrics for such sector rotation strategy, along with the cumulative return chart both with and without rotation. As demonstrated, rotation, on average, outperforms the index by 2.06%, accompanied by a higher Sharpe ratio.
| 1979-2023 | Index | Sector Rotation |
| Sharpe ratio | 0.61 | 0.69 |
| CAGR | 11.40% | 13.46% |
Industry rotation based on maximizing Sharpe ratio for NBER states
An alternative approach to determine the current stage of the business cycle is to use the regime classification of the National Bureau of Economic Research (NBER). The NBER is a well-known organization in the United States responsible for identifying the dates of business cycles, including recessions. Instead of providing real-time announcements of recessions, the NBER conducts thorough research and analysis to determine turning points in the economy.
Looking at industries portfolios, rather than sector portfolios, can provide a more comprehensive understanding by analyzing individual components of the sector that perform better at each stage of the business cycle. Using historical NBER business cycle data and 20-year moving window, we construct two optimal portfolios from different industries that aim to maximize the Sharpe ratio - one for the recession phase and another for the expansion phase. In this manner, we obtain optimal weights for each industry according to the current stage of the business cycle. To mitigate the risk of overexposure to a single industry, we limit the maximum weight assigned to any industry to 20%.
Since NBER data is only available with a a significant delay, we identify the current state by utilizing Dynamic Factor Model based on the dataset (INDPRO, RETAILx, UNRATE, CPIAUCSL, INDEXReturn) with a standardization using a 1.5-year window (More details about the application of DFM have been described in our previous article). Once the current phase is determined, capital is allocated according to the optimal weights of industries previously identified for that phase. The historical test results are provided below.
| 2000-2023 | Index | Industry Rotation |
| Sharpe ratio | 0.50 | 0.79 |
| CAGR | 7.99% | 11.28% |
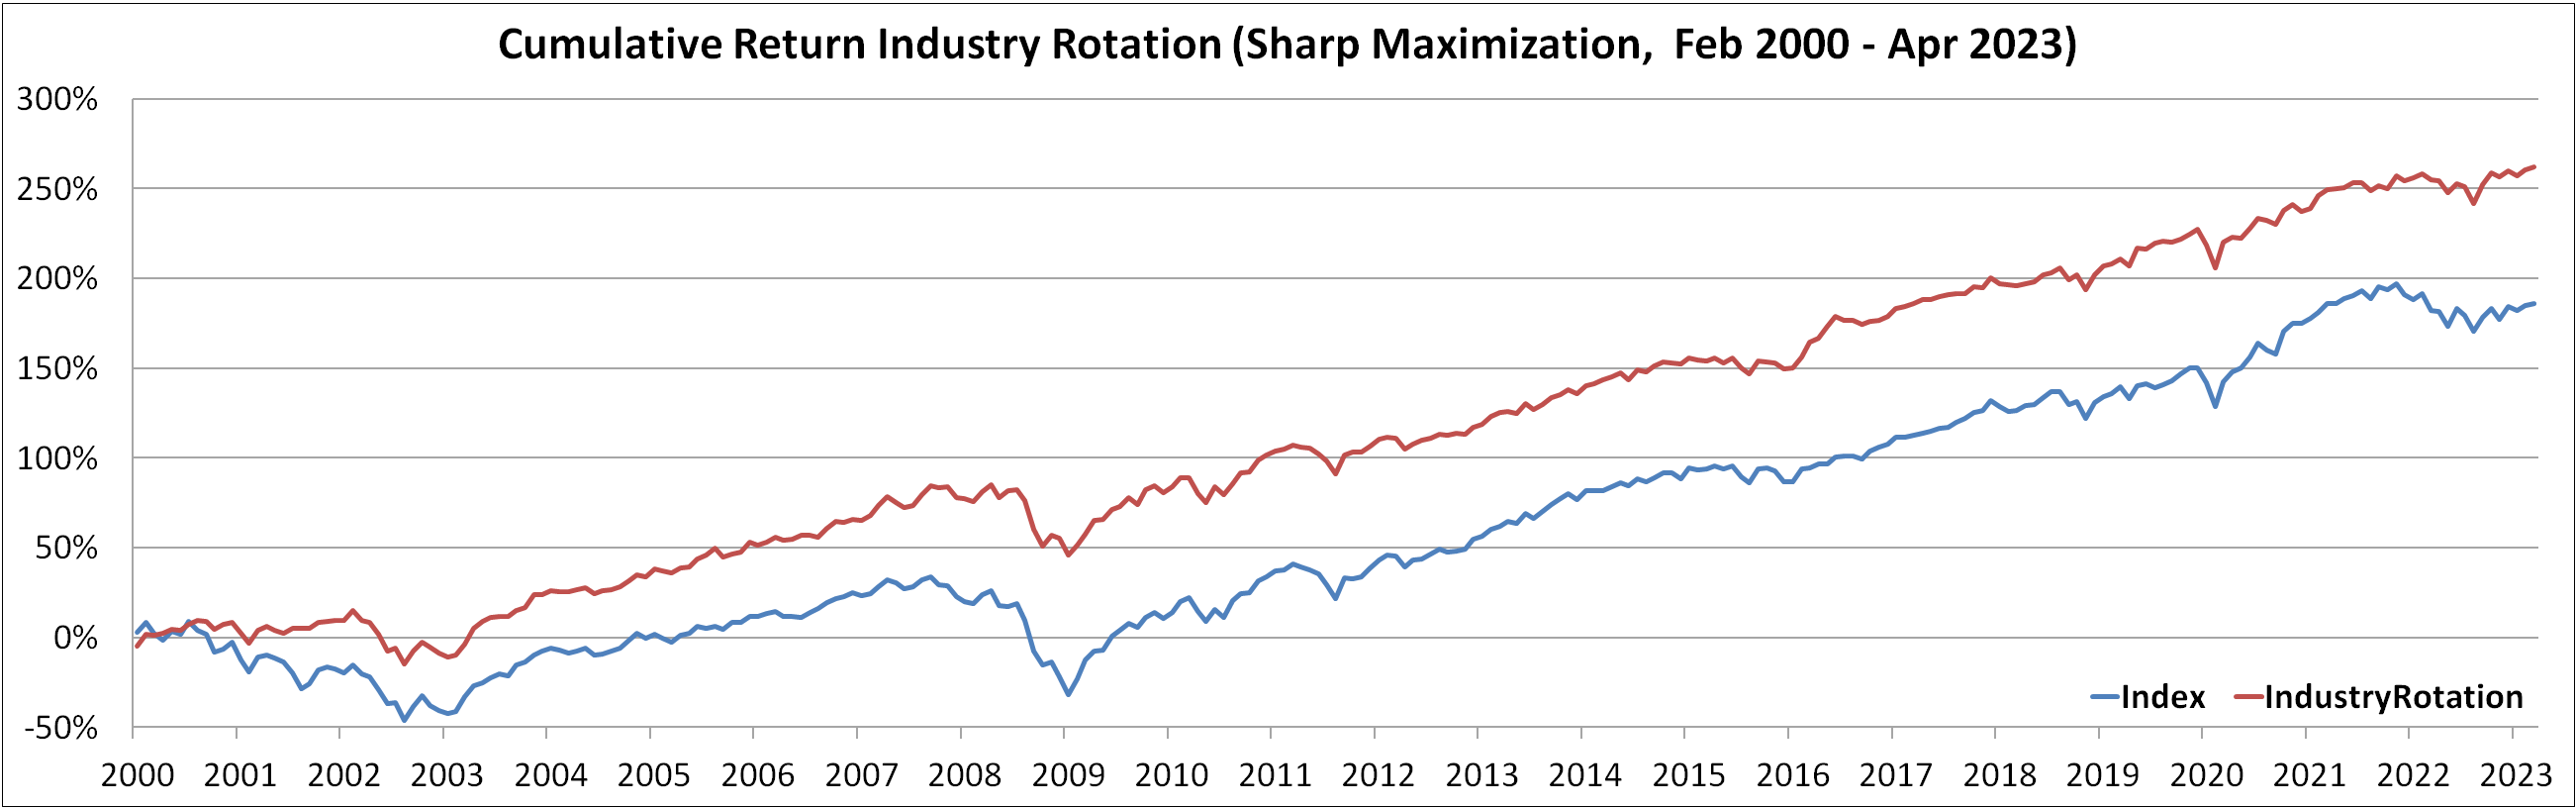
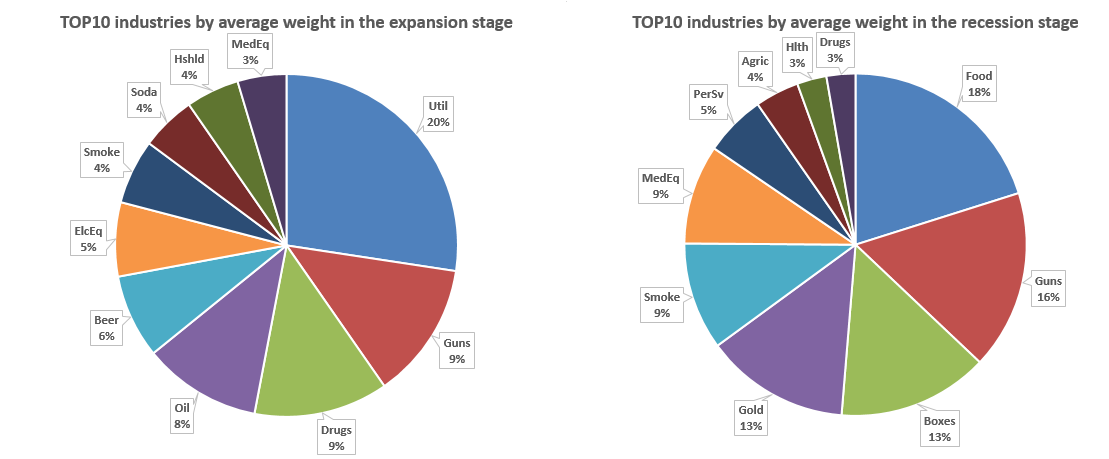
We can see that optimization of weights for a real-time industry rotation strategy also provides an advantage over the index. The average weight during recessions is highest for the food products, defense and shipping containers industry. During recessions, the average weight is highest for food products, defense, and shipping containers industries. Conversely, during expansion phases, the defense industry retains a high average weight, with an increased emphasis on the pharmaceuticals and utilities industries.
Conclusion
Capitalizing on the shifting dynamics of the business cycle, sector rotation presents a potentially effective strategy for investors. This approach, which involves transitioning investments between sectors anticipated to outperform during different cycle stages, can potentially enhance returns while mitigating overall portfolio risk. Further, the refinement of sector rotation based on unique characteristics of each sector can result in predictions that are more accurate than those made by traditional models, leading to a greater strategic advantage in portfolio management.